Published on October 30, 2026
•Institutional Pre-Market Briefing
GEXLogic Daily Briefing | SPX Squeezed at 7725 Wall Amid QQQ Short Gamma Divergence — Oct 30, 2026
GEXLogic Daily Briefing
GEXLogic Quantitative Intelligence
GEXLogic Daily Briefing | SPX Squeezed at 7725 Wall Amid QQQ Short Gamma Divergence
Market Structure Snapshot
VIX SPOT
18.54 (+1.34)
Band: 14.77 - 22.31
SPX REGIME
+$737.0M
Positive Gamma (Spot: 7720.39)
QQQ REGIME
-$641.5M
Negative Gamma (Spot: 698.72)
1. The Macro Volatility Pulse
Spot VIX has surged +1.34 points to print 18.54 heading into the opening bell. Volatility structures are beginning to reflect cross-asset dispersion, yet the macro volatility envelope remains firmly bounded within defined technical parameters:
Technical Resistance Ceiling (22.31): The critical upper-bound regime shift level. A breach above this line triggers systematic volatility targeting fund de-leveraging.
Risk Posture Analysis: The rise in spot VIX while SPX holds positive gamma indicates institutional demand for tail-hedging and tech-skew protection rather than outright broad market liquidations. As long as VIX trades beneath 22.31, market makers retain capacity to absorb sell imbalances on broad indexes, though tech beta volatility will bleed into broader spreads if VIX pushes past 20.00.
2. SPX Gamma Regime & Volatility Skew
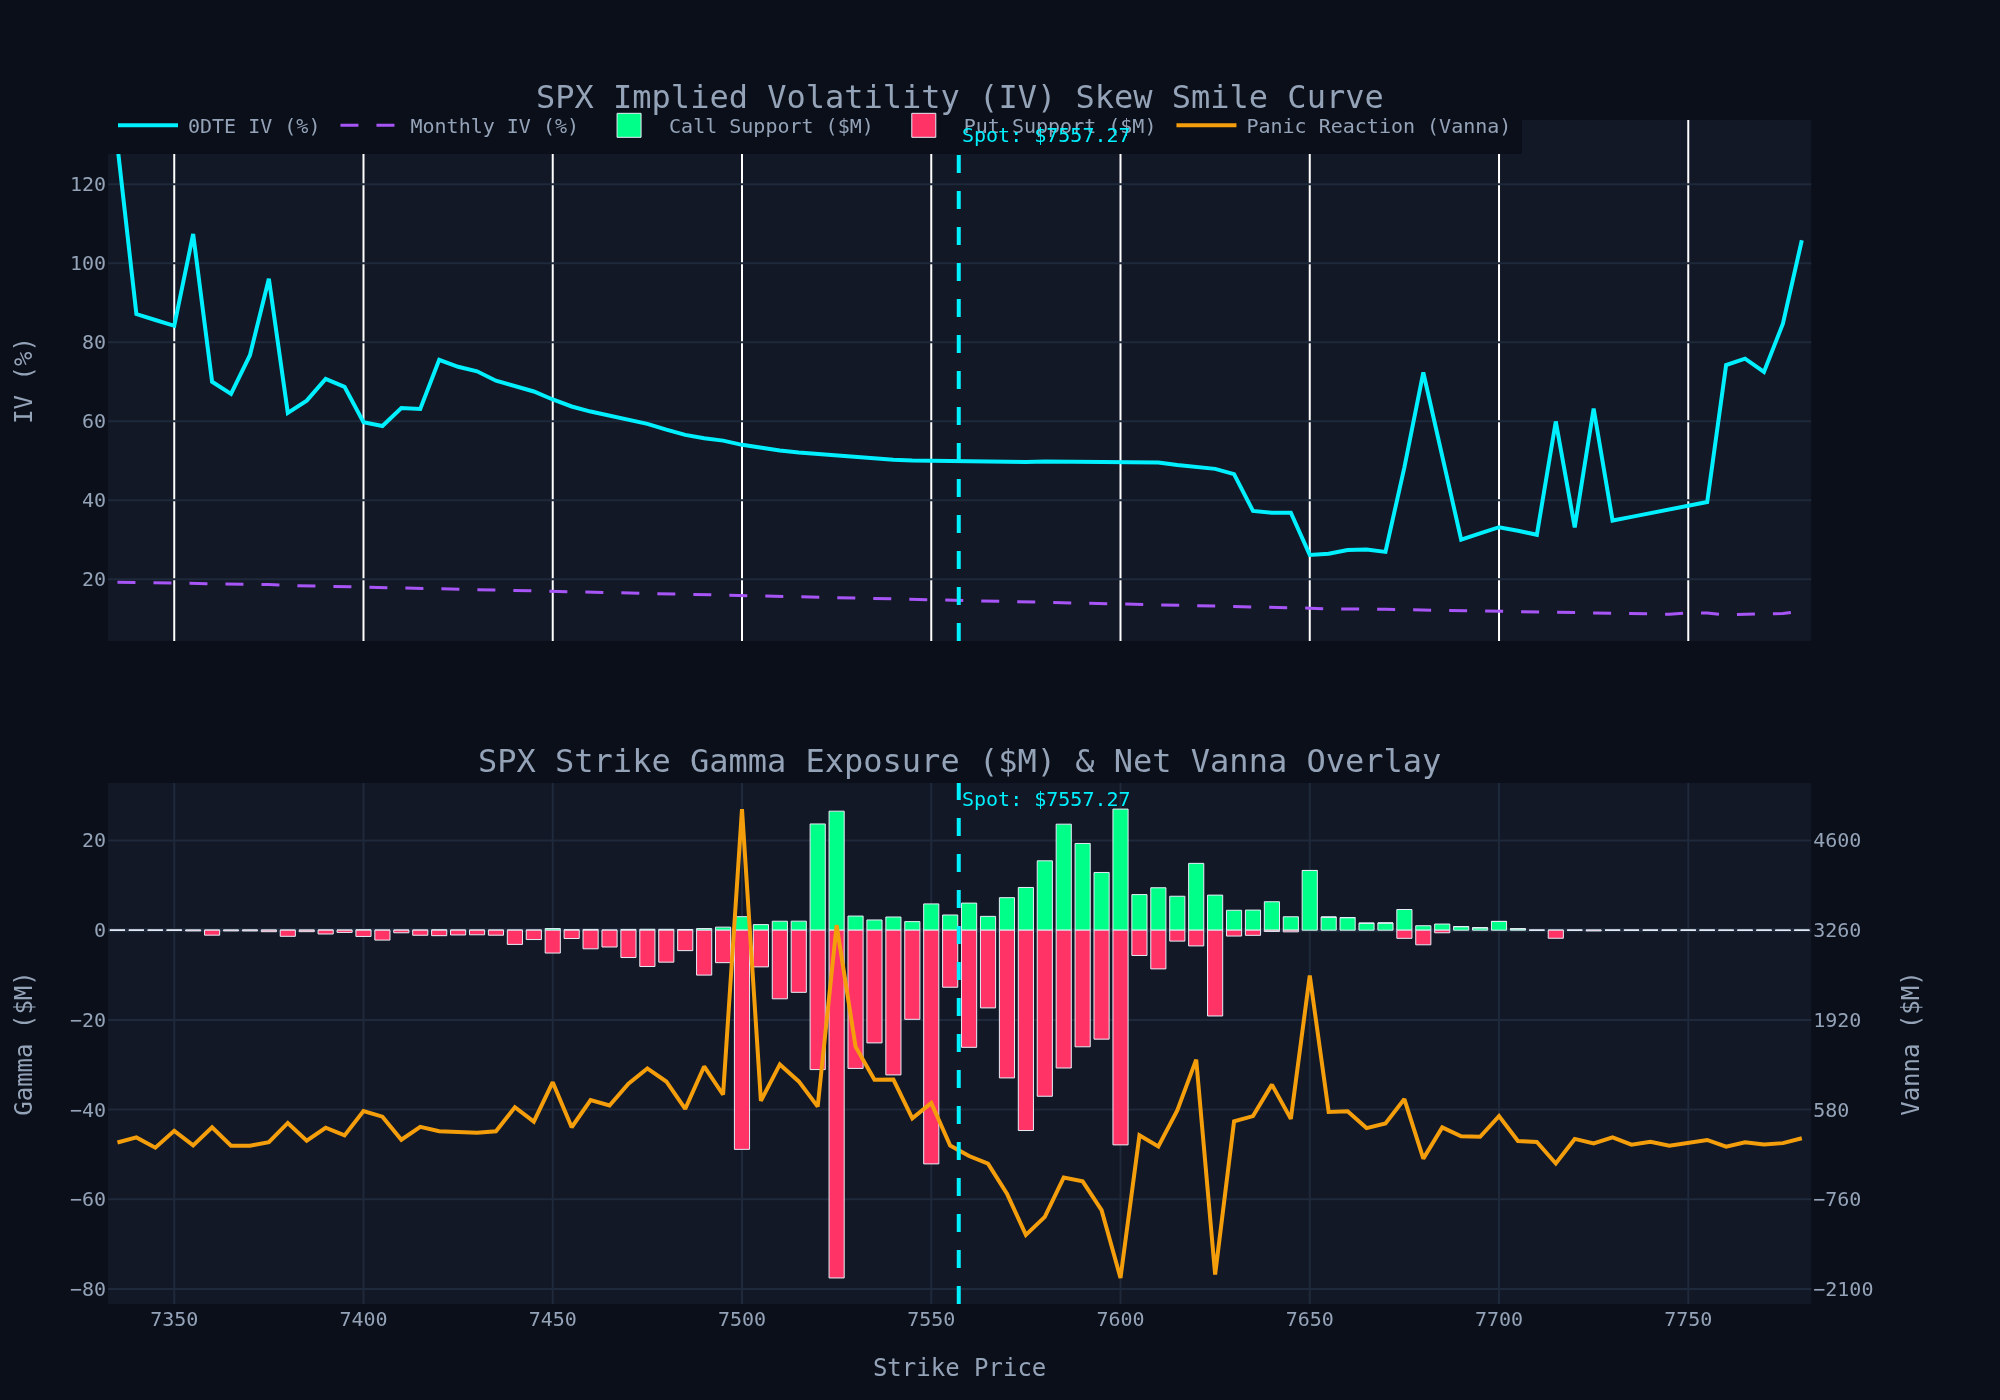
S&P 500 index spot is trading at 7720.39, pinned tightly in a narrow corridor between key dealer gamma structures:
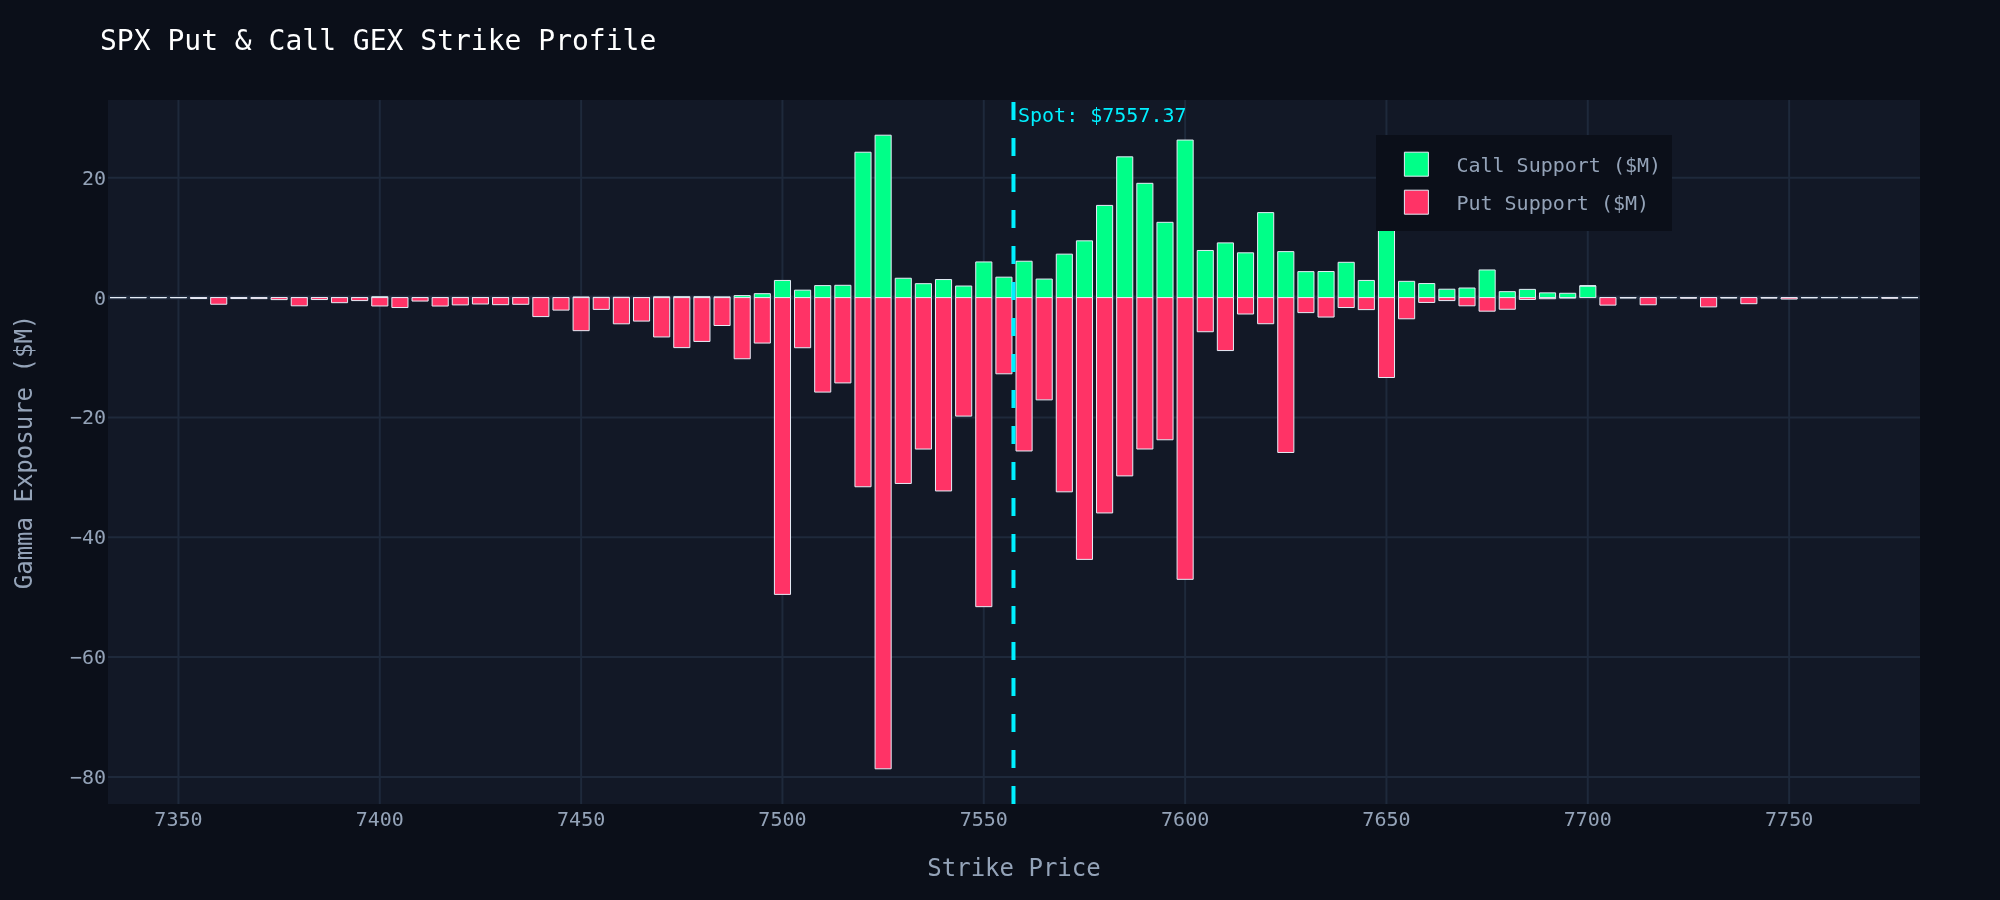
Call Wall: 7725.0
Vol Trigger: 7720.0
Put Wall: 7650.0
With Net GEX standing at +$737.0M, SPX remains in a Positive Gamma Regime. Dealers are long gamma, acting as counter-cyclical liquidity providers by selling into rallies and buying into dips. However, spot is sitting directly on top of the 7720.0 Volatility Trigger and compressed against the major 7725.0 Call Wall.
Panic Reaction Risk: If spot breaches and holds below 7720.0, dealer hedging shifts from supportive to volatile. Skew will steepen rapidly toward the 7650.0 Put Wall as dynamic vanna hedging forces dealers to short futures into market weakness.
3. QQQ Gamma Regime & Tech Beta Divergence
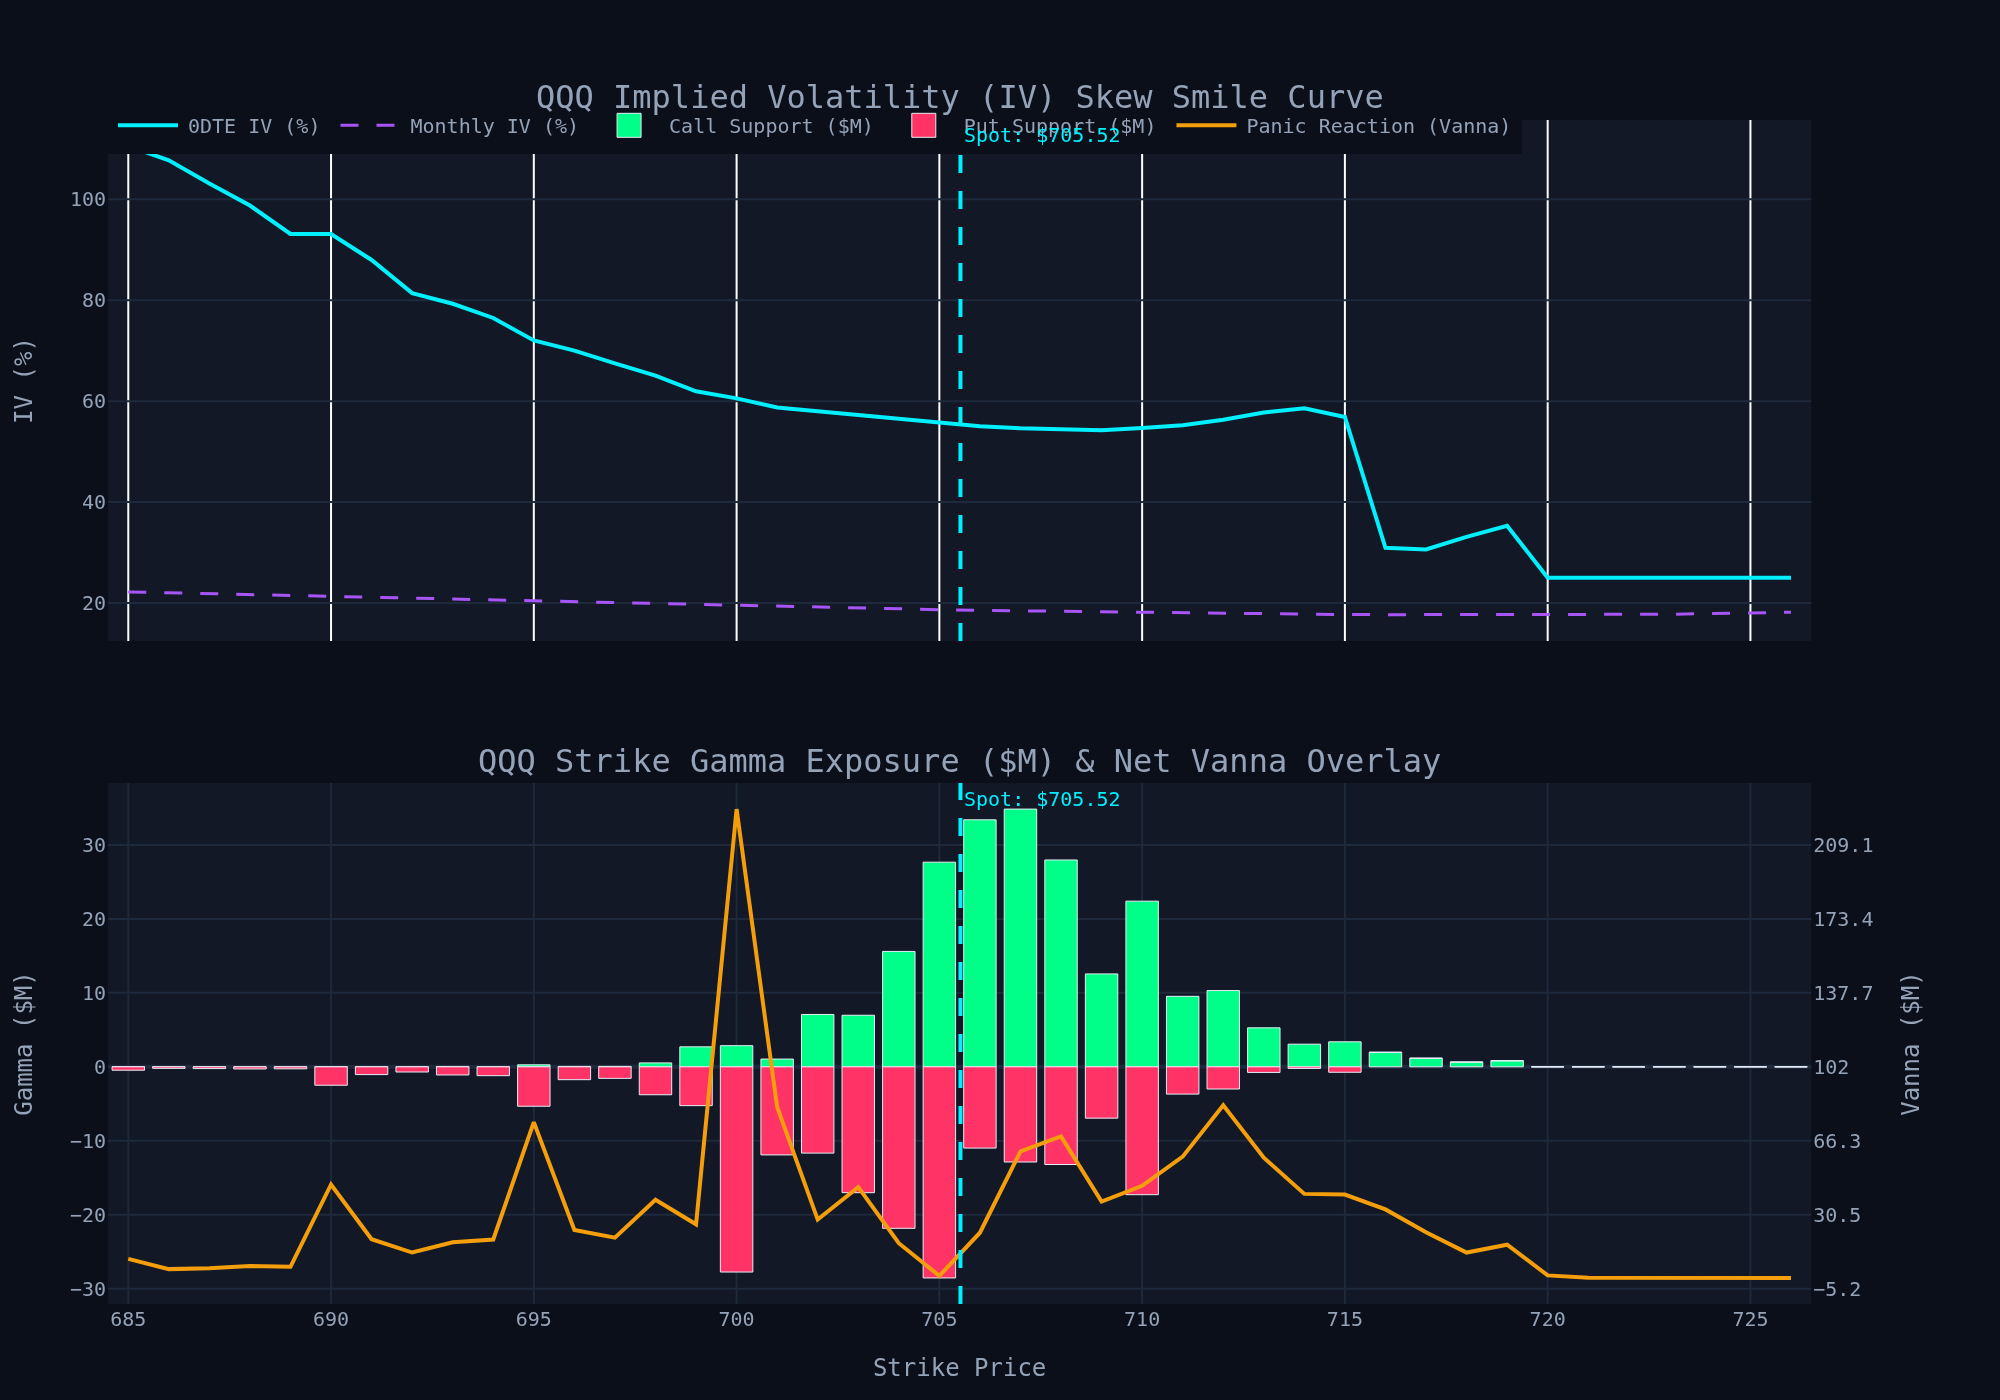
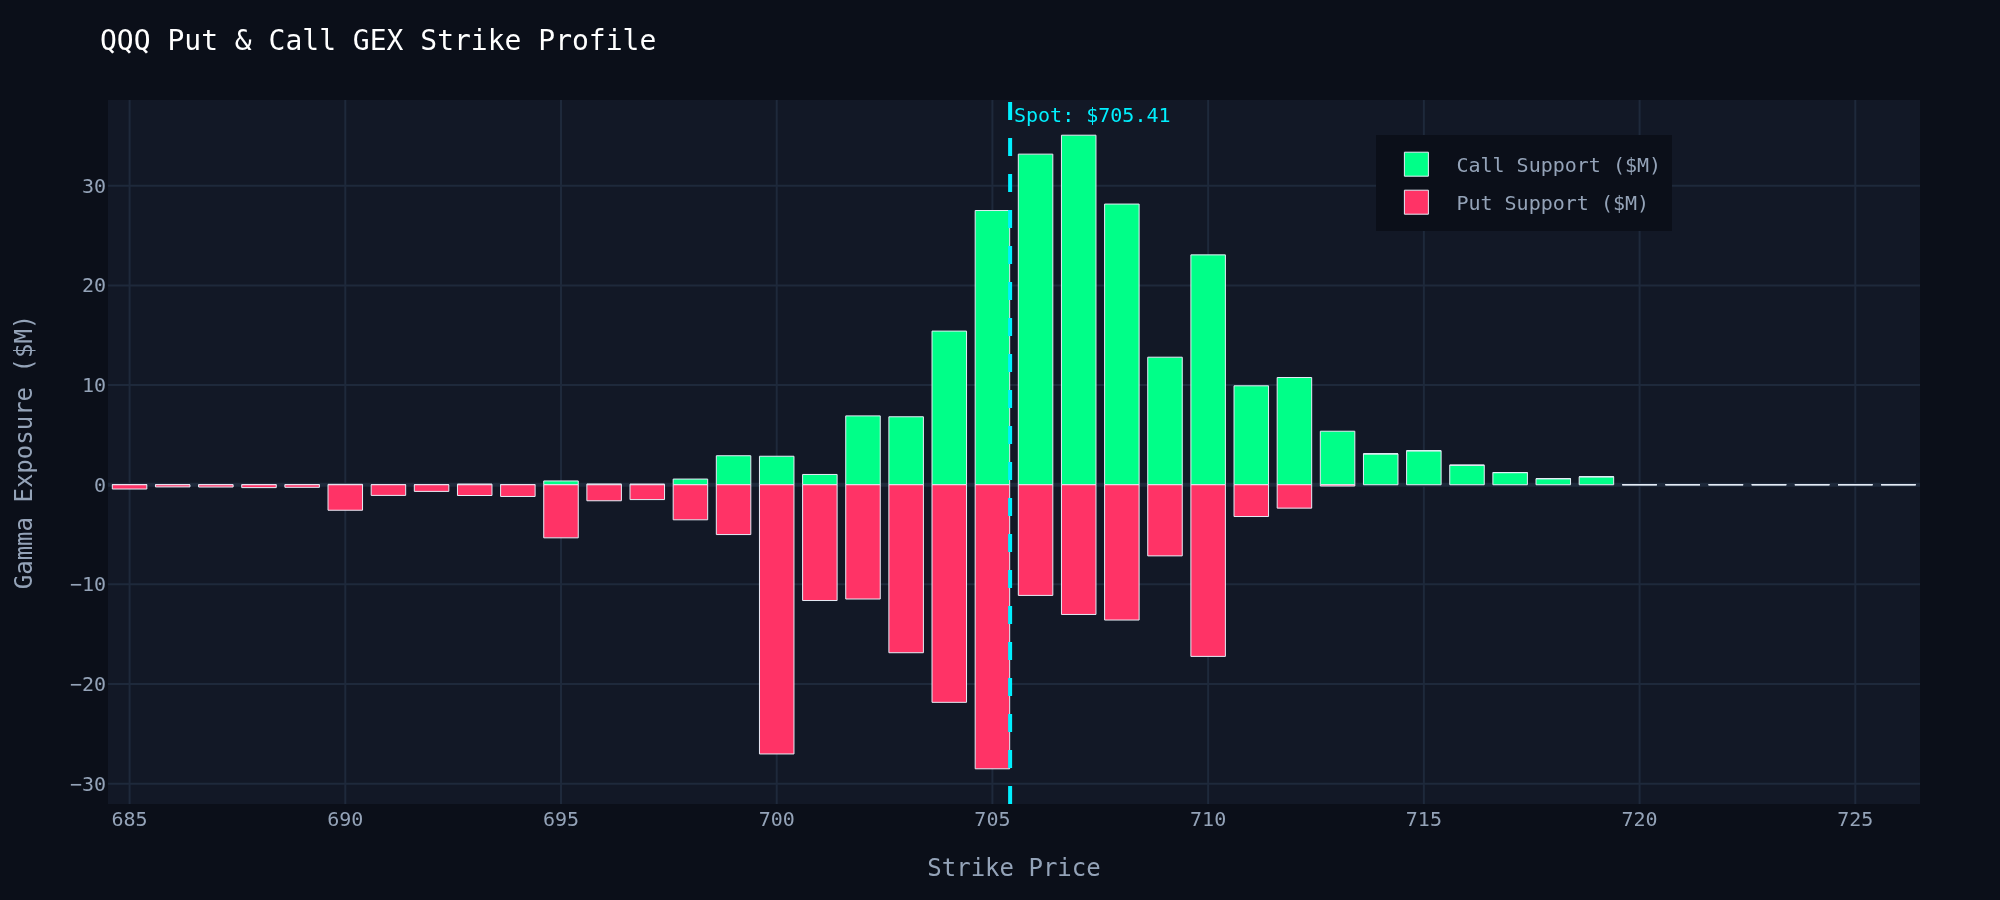
A sharp structural divergence is unfolding in Nasdaq 100 proxy QQQ. Unlike SPX, QQQ has plunged deep into a Negative Gamma Regime with Net GEX sitting at -$641.5M.
Put Wall: 690.0
Spot: 698.72
Vol Trigger: 678.0
Call Wall: 715.0
Short Gamma Acceleration: Because market makers are short gamma in QQQ, their delta-hedging feedback loop is momentum-amplifying—they are forced to sell underlying shares into downside moves and buy into rallies. Spot at 698.72 is rapidly eroding toward the critical 690.0 Put Wall.
Option Smile & Volatility Curvature: Severe demand for OTM downside puts in tech single-stocks has inflated QQQ put skew, raising the option smile curvature. This divergence creates an ideal setup for cross-asset gamma arbitrage: tech beta exposure is vulnerable to rapid liquidation cascades down to 678.0 Vol Trigger, which will eventually drag SPX positive gamma buffer below its own 7720.0 pivot.
4. Actionable Tactical Playbook
Rule 1: Fade SPX 7725 Call Wall Rejections
Do not buy long delta breakthroughs at SPX 7725.0 unless QQQ Net GEX flips positive above 715.0. Expect heavy dealer capping at 7725.0.
Rule 2: Execute Short Delta on SPX Break Below 7720 Vol Trigger
If SPX prints below 7720.0 for >15 minutes, long gamma protection vanishes. Initiate put spreads targeting the 7650.0 Put Wall as vanna flows accelerate.
Rule 3: Exploit QQQ Short Gamma Volatility Expansion
Utilize high-beta tech pullbacks toward QQQ 690.0 to buy debit put spreads or calendarized volatility structures. Avoid selling premium in QQQ until spot reclaims positive gamma territory above 705.0.
Track real-time 0DTE GEX shifts, dynamic Vanna surfaces, and order flow live on your terminal.
GEXLogic Quantitative Research & Market Structure Group | Confidential Institutional Intelligence
Disclaimer: Options trading involves substantial risk of loss and is not suitable for all investors. Quantitative metrics provided for informational and execution-structuring purposes only.
WEEKLY QUANT INTELLIGENCE
Get the Weekly Gamma & Volatility Brief
Join professional traders receiving our pre-market options breakdown, key GEX walls, and regime updates directly in your inbox.