GEXLogic Daily Briefing | SPX Short Gamma Sparks Volatility; QQQ Tests 750 Call Wall — Oct 02, 2026
GEXLogic Daily Briefing | SPX Short Gamma Sparks Volatility; QQQ Tests 750 Call Wall
Institutional Market Structure, Volatility Skew & Dealer Positioning Report
1. The Macro Volatility Pulse
The CBOE Volatility Index (VIX) prints at 15.97 down -0.42 into the opening bell. Despite this modest pullback, volatility remains elevated relative to the structural baseline, reflecting persistent cross-asset friction and localized hedging flows across broad market indices.
The macro volatility corridor is cleanly bounded by technical parameters:
- Technical Support Floor: 13.80 — Represents structural baseline volatility where institutional vol-selling strategies consistently re-engage to suppress implied volatility expansion.
- Technical Resistance Ceiling: 18.94 — Key upside pivot. A sustained breach above this level triggers programmatic tail-risk hedging and delta-hedging liquidation cascades.
VOLATILITY DYNAMICS: VIX spot holding above 15.00 while SPX resides in negative gamma signals an asymmetric risk surface. Spikes in spot VIX will translate to rapid acceleration in equity downside via dynamic dealer short-hedging feedback loops.
2. SPX Gamma Regime & Volatility Skew
S&P 500 options positioning has shifted deeply into a Negative Gamma regime, with Net GEX registering at -$437.2M against an underlying spot of 7666.45. In this posture, market makers are forced to trade with the prevailing intraday trend—selling delta into market drops and buying delta into rallies—amplifying realized volatility.
7700.0
7625.0
7440.0
The immediate upside target sits at the 7700.0 Call Wall, representing major dealer overhead resistance. On the downside, the primary defensive line rests at the 7625.0 Put Wall. If spot breaks below 7625.0, dealer short-gamma hedging will accelerate rapidly toward the structural downside threshold at the 7440.0 Vol Trigger.
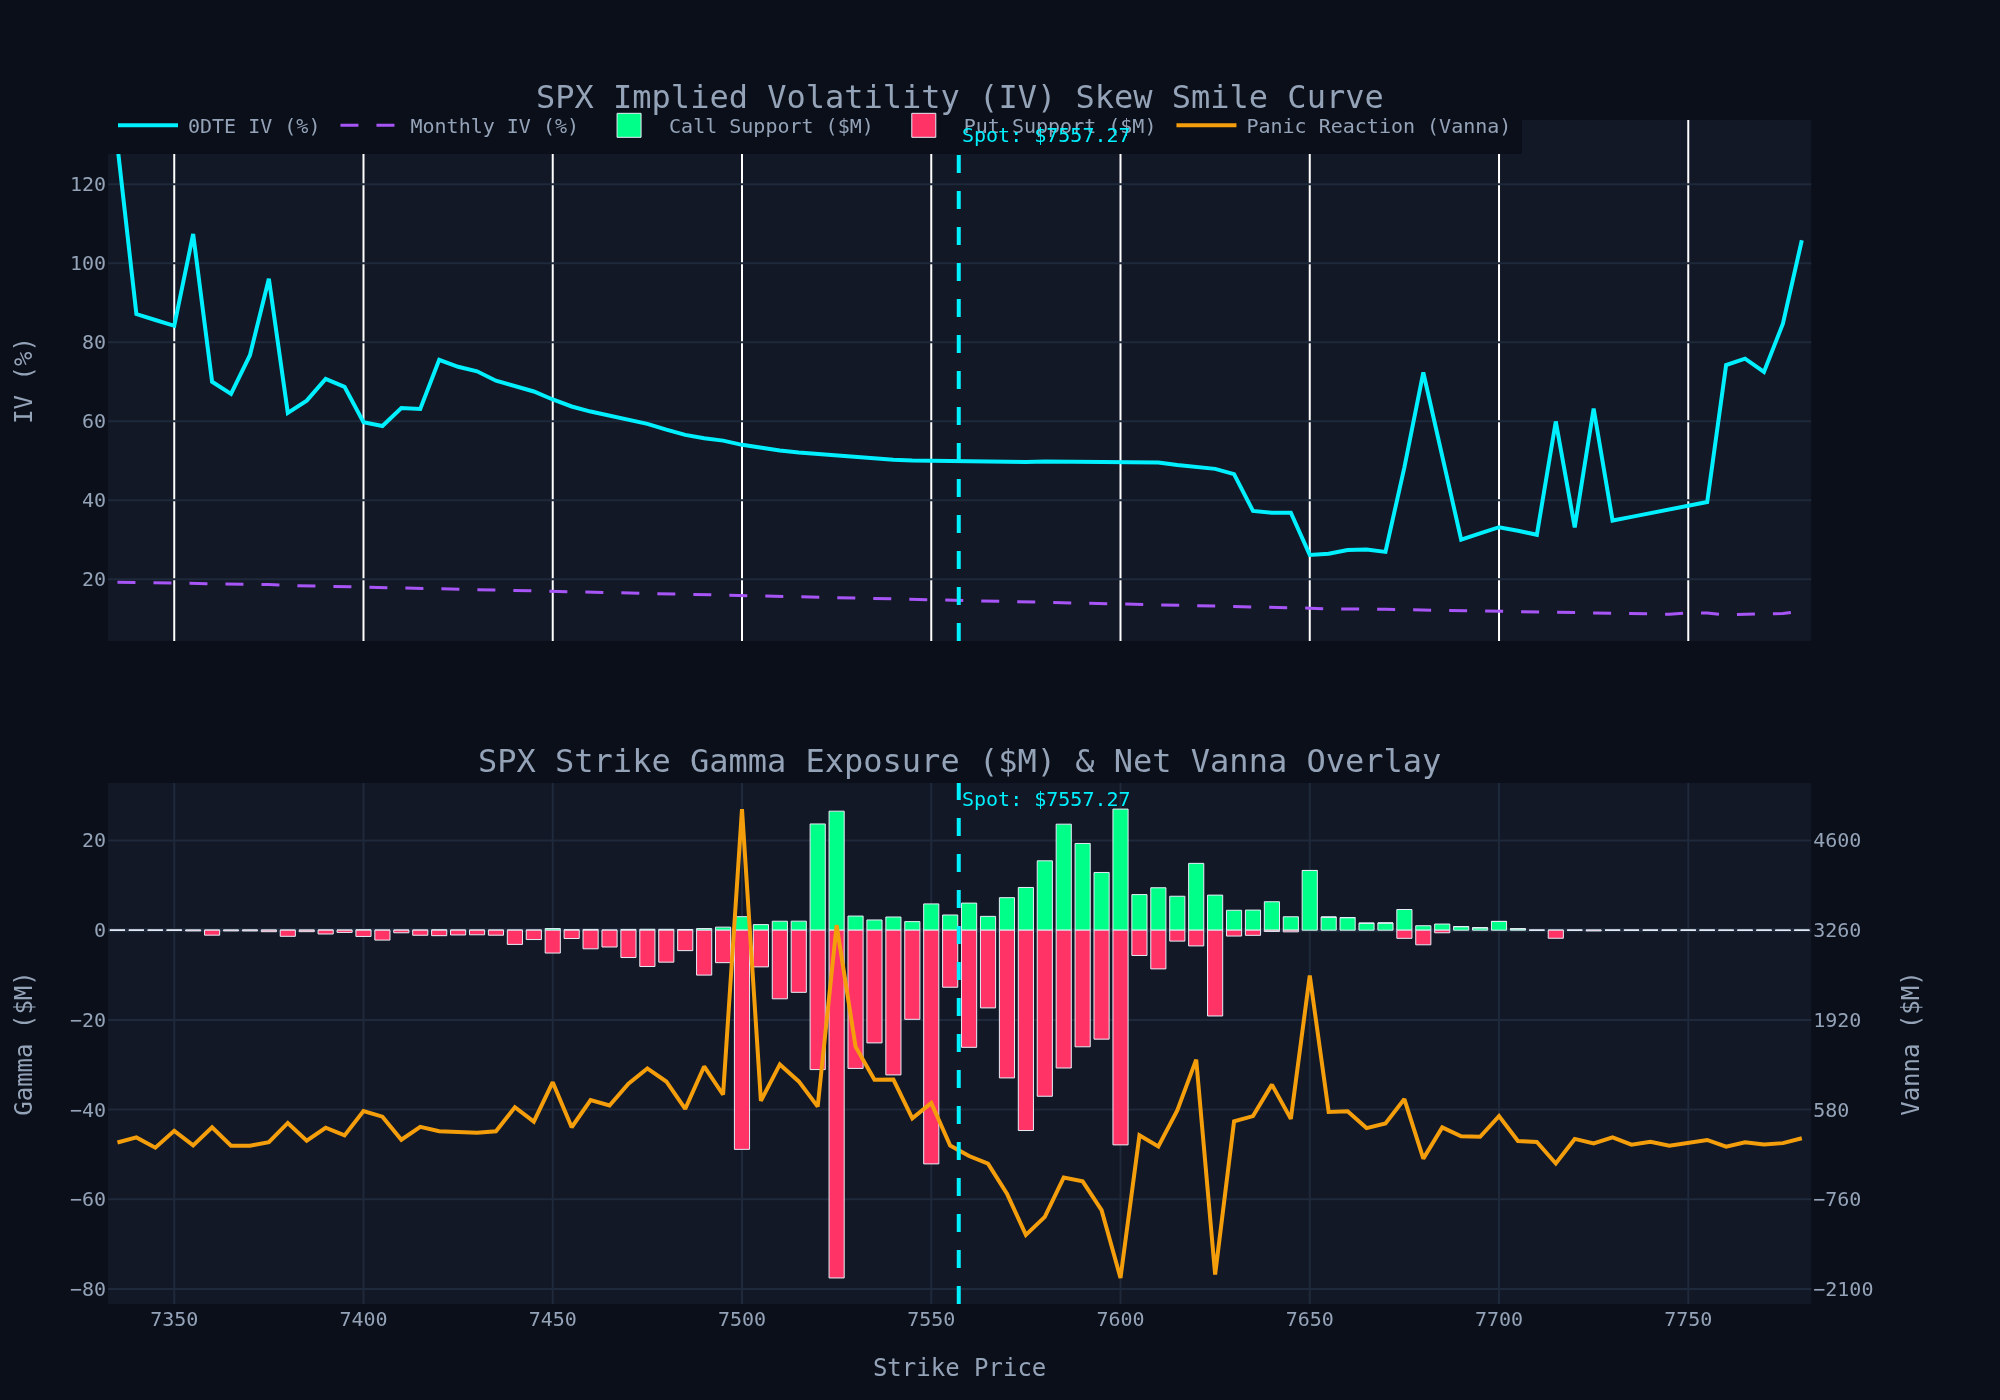
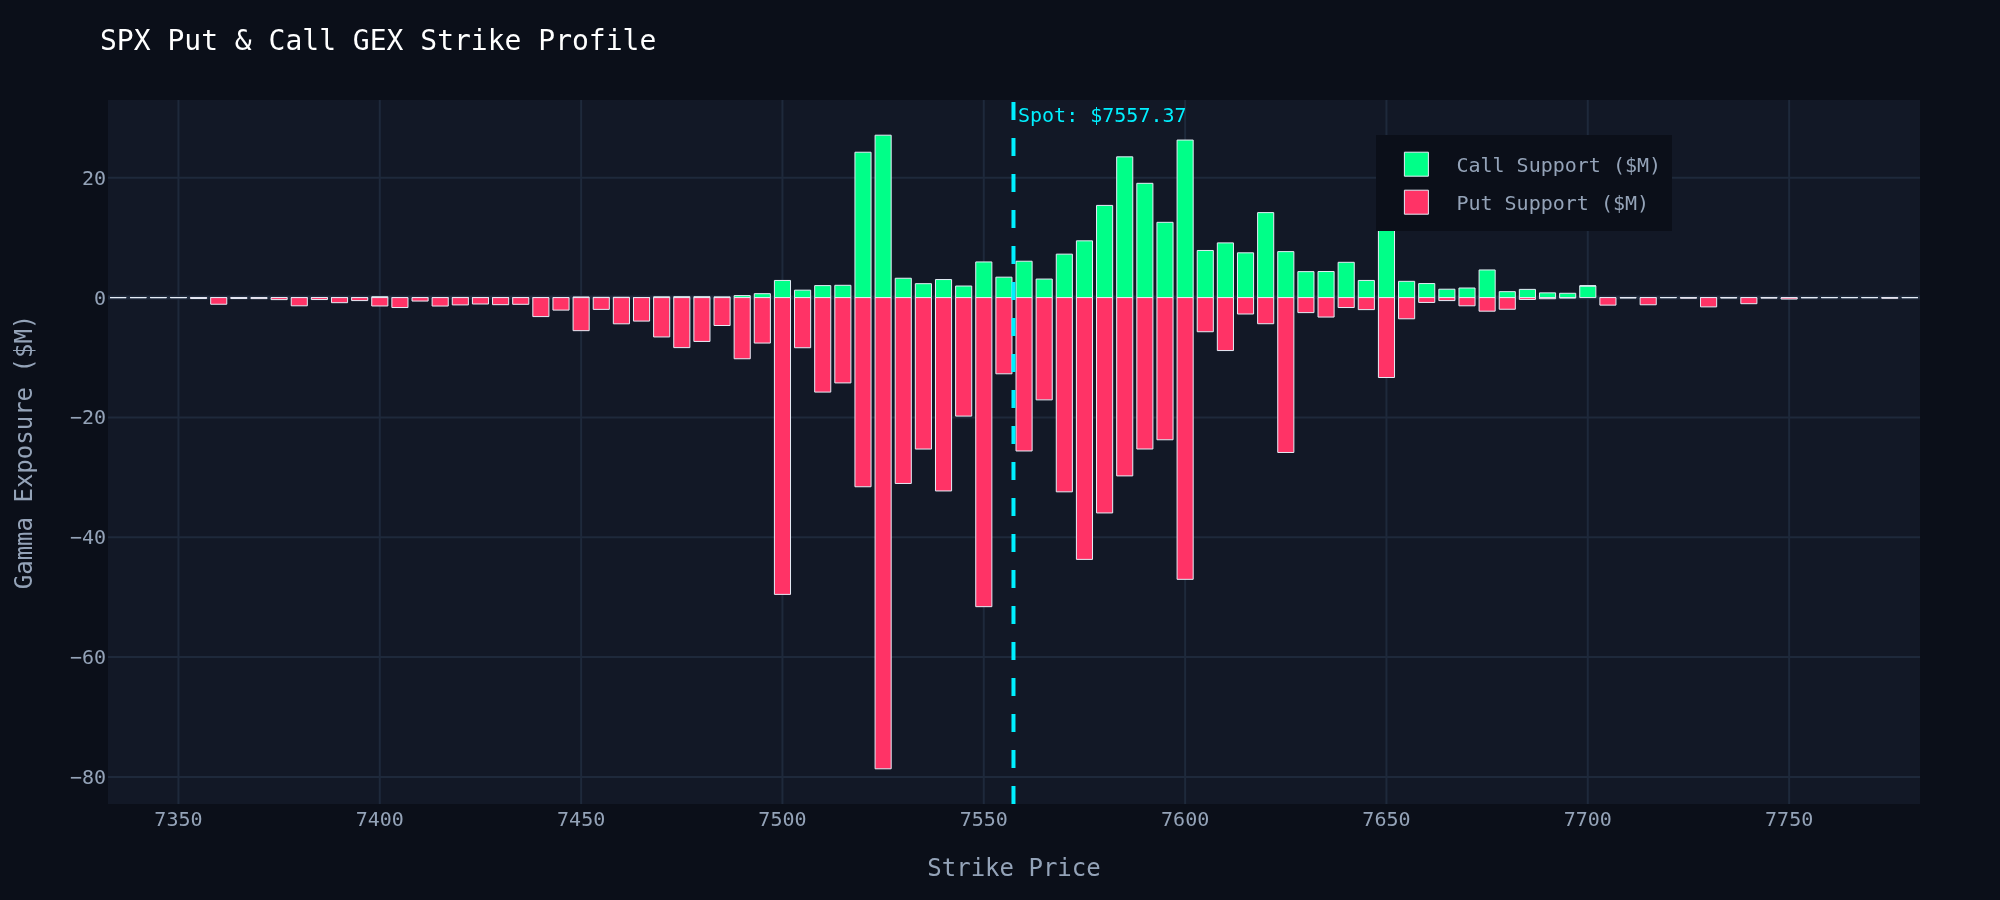
Skew Analysis: Skew exhibits steepening put implied volatility curves below 7625, indicating active institutional tail-hedging. Vanna dynamics indicate that any intraday pop in spot accompanied by crushed IV will trigger intense upside dealer delta re-hedging toward 7700.
3. QQQ Gamma Regime & Tech Beta
In stark contrast to SPX, the Nasdaq-100 ETF (QQQ) maintains a Positive Gamma profile with Net GEX standing at +$168.8M. Spot trades at 747.90, sitting right beneath critical tactical thresholds.
750.0
749.0
730.0
QQQ spot (747.90) is directly challenging its 749.0 Vol Trigger and testing resistance at the massive 750.0 Call Wall. Because dealer long gamma acts as a volatility dampener here, price action near 750.0 is expected to experience strong pinning behavior unless aggressive call buying forces dealers to buy underlying tech stock deltas.
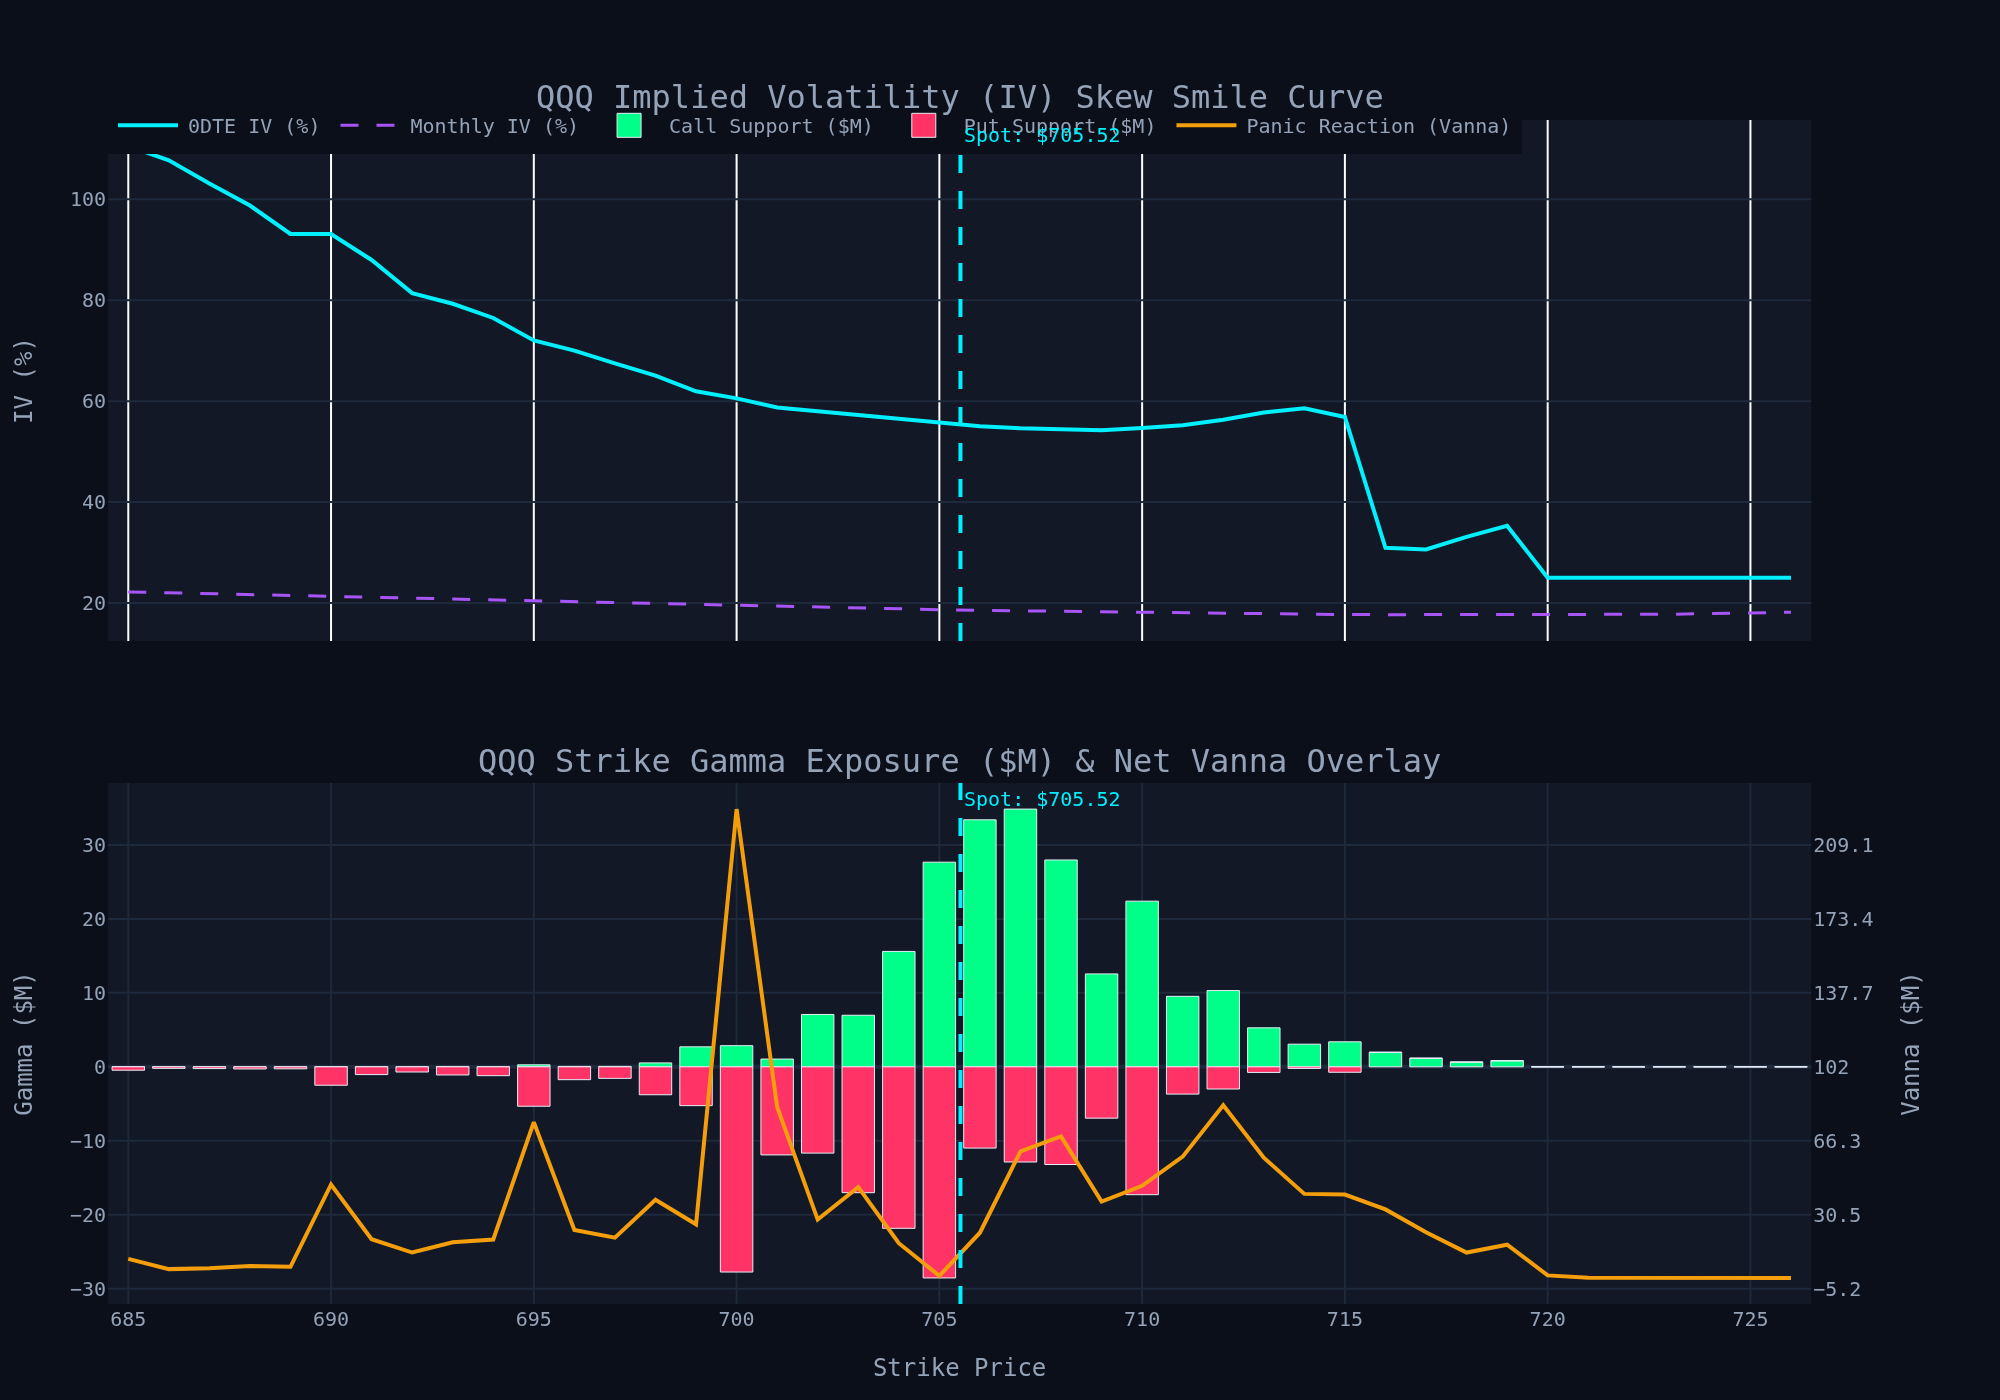
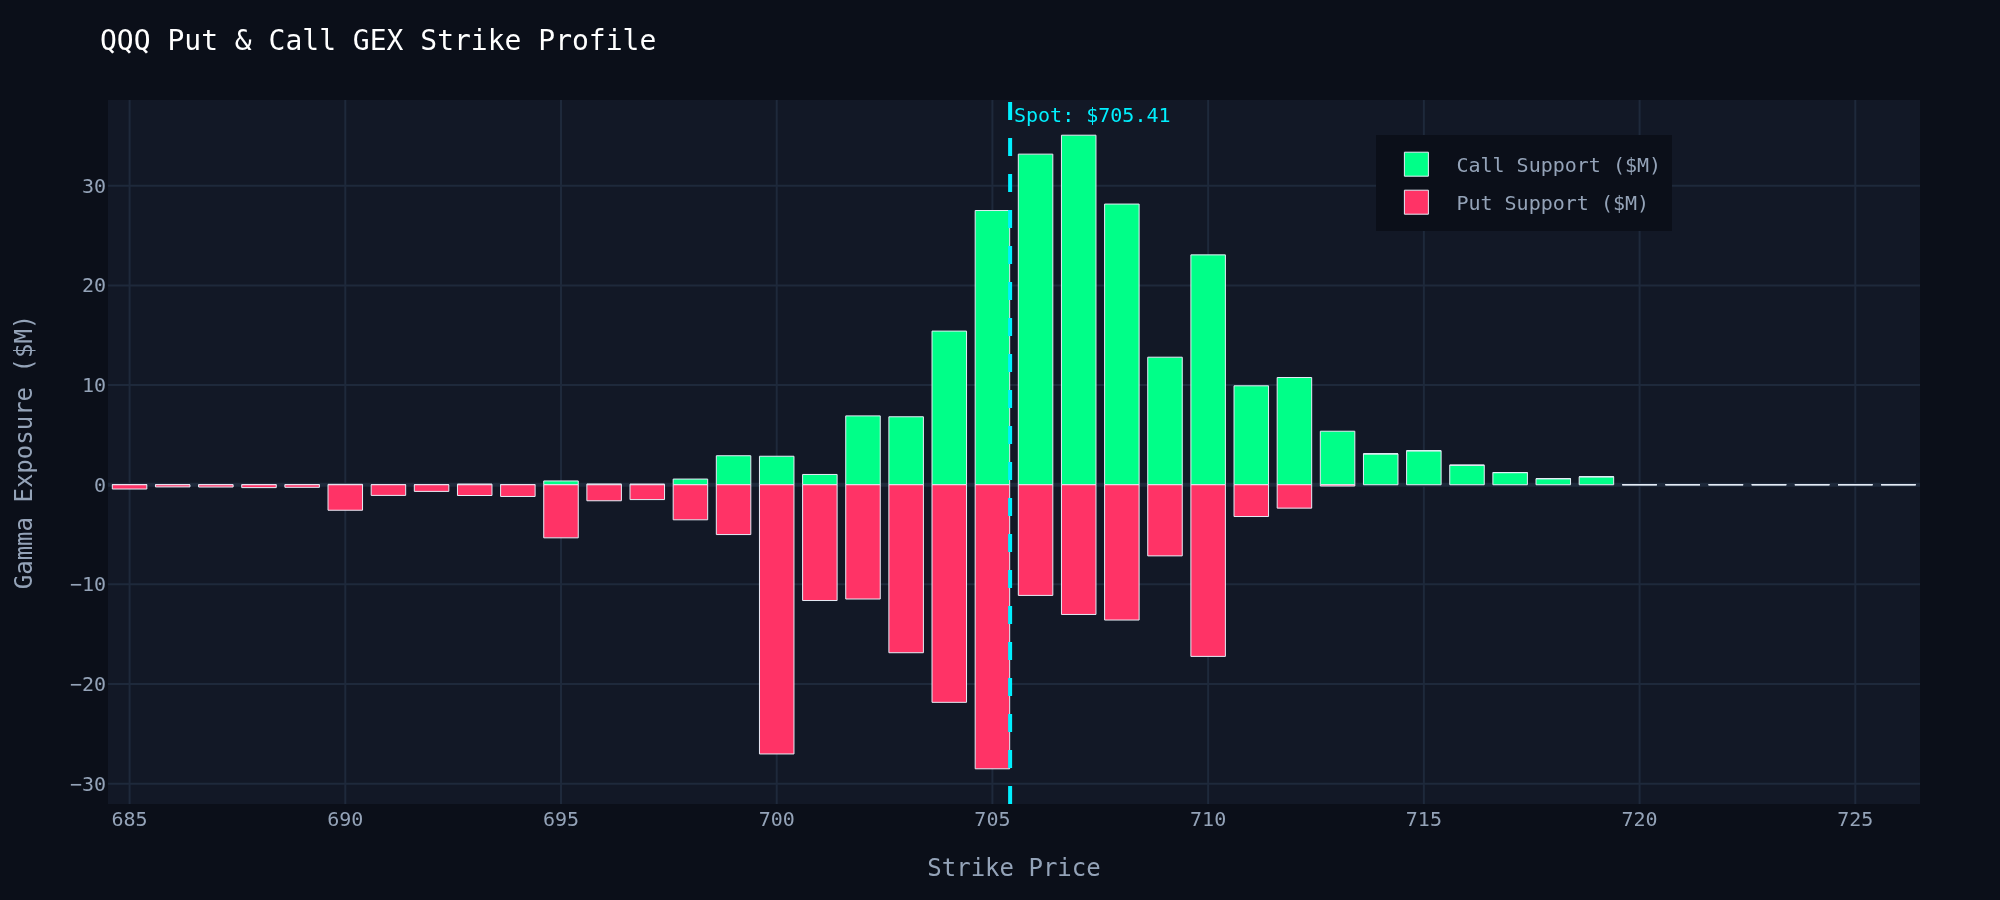
Tech Beta Sensitivity: Major downside support is insulated down to the 730.0 Put Wall. Watch for cross-market divergence: if QQQ rejects 750.0 while SPX remains in short gamma, broad market selloffs will accelerate rapidly.
4. Actionable Trading Playbook
Based on real-time dealer positioning and gamma imbalance across SPX and QQQ, execute the following session rules:
Trade momentum breakouts on SPX while in Negative Gamma (-$437.2M). Avoid mean-reversion strategies between 7625 Put Wall and 7700 Call Wall. Honor stop losses strictly as dealer hedging amplifies slippage.
QQQ remains restricted by positive dealer gamma near 750.0. Look to sell elevated premium (iron condors/short spreads) near 750 unless spot clears 750.50 with a surging call volume sweep.
If spot VIX crosses above 18.94 Resistance while SPX breaches 7625, execute long delta-hedged put spreads targeting SPX 7440 Vol Trigger.
Ready for Market Open?
Track live intraday GEX shifts, order flow, and zero-day options vanna dynamics in real time.
Access your live GEXLogic Dashboard hereGEXLogic Quantitative Research & Market Structure Desk
Confidential Pre-Market Options Intelligence — For Institutional & Professional Trading Use Only.