Gamma Exposure, Dealer Positioning, and the Predictive Structure
Gamma Exposure, Dealer Positioning, and the Predictive Structure of S&P 500 Intraday Moves
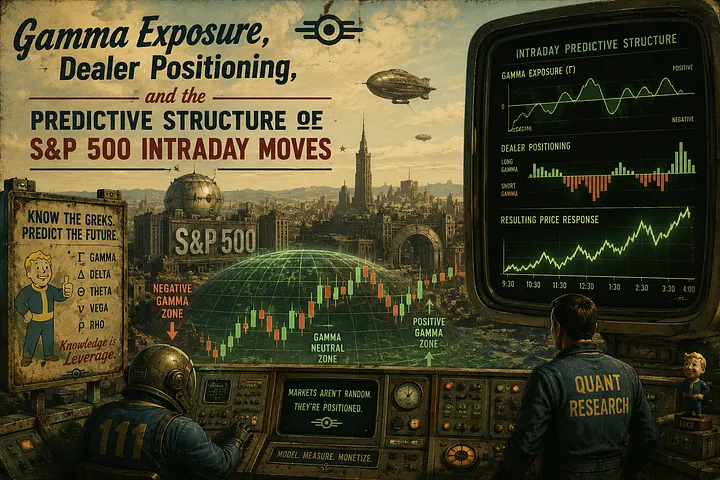
Most investors believe that volatility is driven by news. A Fed statement moves markets. An earnings miss creates a selloff. A geopolitical shock sends the VIX spiking. The news-causes-volatility model is intuitive, visible, and almost universally held. It is also incomplete in a way that costs traders real money.
The mechanism that actually shapes intraday S&P 500 moves — particularly the compression of realized volatility during calm periods and its sudden expansion during dislocations — runs through the options market, not the news cycle. Specifically, it runs through the hedging behavior of the dealers who sit on the other side of every options trade. Understanding how their inventory forces them to act, and when that force reverses, is one of the most practically useful things a serious market participant can learn.
This article walks through the mechanism in four steps: (1) what dealer gamma exposure actually measures, (2) how positive gamma creates a mechanical suppressor of intraday moves, (3) how negative gamma inverts that dynamic and amplifies moves, and (4) what a trader who understands the mechanism monitors differently from one who does not.
## What dealer gamma exposure actually measures
**Gamma** is the rate of change of an option’s delta with respect to the underlying price. Delta measures how much an option’s value changes for a one-point move in the underlying; gamma measures how much that delta itself changes. A long call with a delta of 0.40 and a gamma of 0.05 will have a delta of approximately 0.45 if the underlying rises one point, and 0.35 if it falls one point.
Dealers — the market makers who write options to retail and institutional buyers — are typically short options in aggregate. When retail investors buy calls on the S&P 500 (through instruments like SPY or SPX options), the dealer who sold those calls is short gamma. When protective put buying dominates, the dealer who sold those puts is also short gamma in aggregate, though the hedging mechanics differ in direction.
**Dealer gamma exposure (GEX)** aggregates this across the entire options book: it estimates, in dollar terms, how much the delta of dealers’ combined inventory changes for a one-point move in the S&P 500. A positive GEX reading means dealers are net long gamma across their book. A negative GEX reading means they are net short gamma.
The sign of GEX tells you which direction dealers are forced to trade when the market moves. That forced trading is the mechanism.
## Positive gamma: the mechanical suppressor
When dealers are net long gamma — GEX is positive — they face a specific problem every time the market moves. Their delta exposure increases as the market rises and decreases as the market falls. To stay delta-neutral (the standard risk mandate for a market maker), they must continuously sell into rallies and buy into declines.
The sequence runs precisely as follows:
1. S&P 500 rises 10 points. Dealers’ long call positions gain delta (gamma is positive, so delta increases with price).
2. Dealers are now net long delta — they have more directional exposure than their risk mandate allows.
3. They sell S&P 500 futures or SPY shares to reduce delta back to neutral.
4. That selling absorbs buying pressure and caps the rally.
5. The same logic runs in reverse on declines: dealers buy to rebalance, absorbing selling pressure.
The result is a self-correcting mechanical bid-ask around the current price level. Every move away from equilibrium triggers dealer hedging that pushes back toward equilibrium. Realized volatility compresses. The market feels “sticky” — it trends less, mean-reverts more, and large intraday swings get absorbed before they develop momentum.
This is not a coincidence or a market-structure curiosity. It is a direct consequence of the delta-neutral mandate that governs most dealer operations. The mandate exists because dealers are not paid to take directional risk; they are paid to capture the bid-ask spread and the volatility premium embedded in the options they sell. To do that profitably, they must hedge their delta continuously.
The practical signature of a positive-GEX regime: intraday ranges compress, the VIX tends to drift lower or stay suppressed even when macro uncertainty is elevated, and sharp moves that begin on news often reverse within the same session as dealer hedging absorbs the momentum.
## Negative gamma: the amplifier
When GEX turns negative, the same mechanical logic inverts — and the consequences are severe.
In a negative-gamma regime, dealers are net short gamma across their book. Their delta exposure now moves in the same direction as the market: it increases when prices fall (they become more short) and decreases when prices rise (they become less short). To stay delta-neutral, they must sell into declines and buy into rallies.
The sequence:
1. S&P 500 falls 10 points. Dealers’ short put positions lose delta (they become more short the underlying as puts move deeper in-the-money).
2. Dealers must sell more S&P 500 futures to maintain delta neutrality.
3. That selling adds to the decline rather than absorbing it.
4. The decline accelerates, forcing further rebalancing.
5. The same logic amplifies rallies: dealer buying into rising prices adds fuel to upward moves.
This is a procyclical feedback loop. Dealers are no longer a stabilizing force; they are a destabilizing one. Moves that would have been absorbed in a positive-gamma regime instead get amplified. Intraday ranges expand dramatically. Realized volatility can spike not because anything fundamental changed, but because the mechanical structure of the market flipped.
The historical record is consistent on this point. The August 2015 flash crash, the February 2018 volatility spike (the “Volmageddon” episode), and the rapid S&P selloffs that characterized late 2018 all occurred in periods where dealer positioning was heavily short gamma. The VIX did not simply reflect uncertainty in those episodes; it was partly being driven by the mechanical hedging flows that negative gamma creates.
A useful way to think about the difference: in positive-gamma regimes, dealers act as shock absorbers. In negative-gamma regimes, they act as accelerants.
## The gamma flip level
Between the positive and negative regimes sits a specific price level where aggregate dealer GEX crosses zero. This is called the **gamma flip level** (sometimes the “gamma neutral level” or “zero gamma line”). It is not a static support or resistance level in the traditional technical sense; it is a dynamic threshold that shifts daily as options expire, new positions are opened, and the underlying moves relative to the strike distribution.
When the S&P 500 is trading above the gamma flip level, dealers are typically long gamma and the suppression mechanism is active. When it trades below, dealers typically go short gamma and the amplification mechanism activates. The flip level is therefore not a price target — it is a regime boundary.
The regime change at the flip level is often abrupt. A market that has been trading in a compressed 0.3% daily range can see that range double or triple within a day or two of crossing the flip level, with no change in the macro backdrop. Traders who attribute the volatility expansion to news are observing the effect, not the cause.
The gamma flip level also explains a pattern that confuses many traders: why large-cap indices sometimes become more volatile during options expiration weeks rather than less. As expiration approaches, the gamma associated with near-term options decays rapidly (theta decay accelerates, and gamma near expiration is concentrated near the money). If the dominant near-term options are calls that dealers are long, their expiration removes the suppression mechanism — and the market can move more freely in the days immediately following expiration.
## When the mechanism breaks
No mechanical relationship in markets is permanent. The GEX-to-volatility link has failure modes worth understanding.
The first is **speed of move**. Dealer delta-hedging is continuous but not instantaneous. When markets gap down on a major catalyst — a surprise Fed decision, a geopolitical shock, a large earnings miss after hours — the gap itself bypasses the hedging mechanism. Dealers cannot sell into a decline that happens in a single tick. In those environments, the GEX regime matters less than the magnitude and speed of the initial shock. The February 2018 VIX spike (when the VIX itself rose from 17 to 37 in a single session) was partly a speed-of-move event: the initial shock was too fast for hedging flows to absorb.
The second is **expiration-driven regime change**. At major options expirations (particularly the quarterly “triple witching” and the monthly SPX expirations), large blocks of options expire and are removed from the dealer book simultaneously. The GEX can shift by tens of billions of dollars in a single session. If a large long-gamma position expires and is not replaced, the market can transition from positive to negative GEX within hours. Traders who do not track the expiration calendar alongside GEX can be caught by what appears to be an unexplained volatility expansion.
The third is **structural crowding**. When a large number of market participants simultaneously buy puts (for protection) or calls (for leverage), the dealer book can shift quickly from balanced to heavily short gamma. The 2020 COVID crash accelerated partly because institutional put-buying in February 2020 pushed dealers deeply short gamma before the full magnitude of the shock was known. The GEX signal had been deteriorating for weeks before the crash; the news event was the trigger, but the structural positioning was the accelerant.
The fourth is **tail events that overwhelm the no-arbitrage assumption**. GEX analysis assumes that dealers hedge continuously and that their hedging flows are the dominant mechanical force. During extreme dislocations — the 2008 financial crisis, the March 2020 COVID crash — dealer balance sheets themselves come under stress, hedging becomes intermittent, and the mechanical relationship between GEX and realized volatility breaks down. These are the periods when the VIX reaches historically extreme levels (the 2020 peak was 82.69 on March 16; the 2008 peak was 89.53 on October 24) and the normal suppression/amplification framework stops being the primary driver.
## What you monitor differently
A trader who understands the GEX mechanism does not watch price and news in isolation. They track three additional inputs.
**First, the sign and magnitude of GEX.** Positive GEX above roughly $1 billion (in notional S&P 500 equivalent) is associated with suppressed realized volatility and mean-reverting intraday behavior. Negative GEX is associated with expanded ranges and trending intraday behavior. The sign alone does not tell you direction; it tells you the volatility regime.
**Second, the gamma flip level relative to current price.** If the S&P 500 is 2% above the flip level and drifting lower toward it, that is a different setup than if it is 2% above and trending higher. Proximity to the flip level signals that the regime could change quickly, and position sizing should reflect that.
**Third, the expiration calendar.** Large expirations (monthly SPX, quarterly triple witching) are scheduled events that can shift GEX significantly. The days immediately following a large expiration are structurally more volatile than the days preceding it, because the suppression mechanism associated with near-term long-gamma positions is removed. Knowing this in advance is worth more than most macro calendars.
The practical implication is concrete: mean-reversion strategies that work well in positive-gamma regimes (buying intraday dips, fading intraday rallies) tend to fail or reverse in negative-gamma regimes. Momentum strategies that require trending intraday behavior work better when GEX is negative and dealers are amplifying rather than absorbing moves. Matching your strategy to the GEX regime is not a refinement — it is a prerequisite for consistent execution.
The mechanism is not a prediction of direction. It is a prediction of volatility character. Dealers do not know where the market is going; they are hedging their inventory, not expressing a view. But their hedging flows are large enough, systematic enough, and structurally predictable enough that ignoring them means trading a market you do not fully understand.
Ready to Track These Levels in Real Time?
Stop calculating options Greeks manually. Access real-time HIRO order flow, Call Walls, Put Walls, and Volatility Triggers across 3,500+ equities instantly.
Related Quantitative Insights

Prospect Theory in Options Trading Behaviour
Prospect Theory in Options Trading Behavior: Behavioral Foundations, Empirical Evidence, and Market Implications